SIGNAL traffic_volume DETECTOR rateOfChange CONFIDENCE 82% STATUS explained

Observability with a paper trail

Stop guessing
why the graph moved.

Panopticon watches every signal you configure, explains what changed and how sure it is, and shows your customers and your own teams the same evidence — without ever handing anyone a query language.

 LIVE EVIDENCE 15m WINDOW
Traffic rose 32% above the expected band.
14 minutes · rateOfChange · 82% confidence
Missing data ruled out — this is real.
The old way

A graph is not an answer.

?

Most monitoring tools show you a line that moved. They don't say whether it's normal, how sure they are, or what to do next. Someone gets paged and starts guessing — and your customer opens a support ticket to ask a question your own systems already know the answer to.

The Panopticon way

Evidence, not vibes.

Panopticon shows the same shape of chart — plus the expected range, the confidence score and a plain-English sentence explaining exactly what happened and for how long.

How it works

From raw metric to plain-English evidence, in four steps.

Every step below is deterministic, typed and reproducible — you can see exactly why any evidence was produced, months later.

01 · Connect

Point it at what you already have

Panopticon reads your existing metrics store. Nothing to migrate, nothing to re-instrument, no new agents to roll out.

02 · Define

Describe a signal once

What it counts, how values combine, who's allowed to filter by what — written once as a typed, validated document. No code required.

03 · Detect

Thirteen ways to watch

Sudden jumps, slow drift, stuck sensors, quiet feeds, statistically unlikely rates — each signal gets the detector that actually suits it.

04 · Explain

A sentence, not a verdict

Every finding carries an observed value, an expected range, a confidence score and a plain-English explanation — logic you can read, not a model you have to trust blindly.
Who it's for

The same evidence, three different jobs.

Nobody gets a watered-down view. Everybody gets exactly the scope their job needs — enforced on the server, not trusted to the browser.

Your customers

Give people transparency instead of a support queue. They see their own service's health and explore their own questions inside a scoped, safe view — and never see another customer's data, because the server enforces that on every query, not the interface.

Your teams

One portfolio view ranks every customer by current health, then drills into the exact evidence a customer would see. No more a dozen bespoke dashboards, and no more paging someone at 2am just to squint at a graph.

Your leadership

An audit trail for every domain change, every published detector, every access grant. When someone asks "why did the system say that", there's a deterministic, versioned answer — not a shrug.

See the full picture →

See it

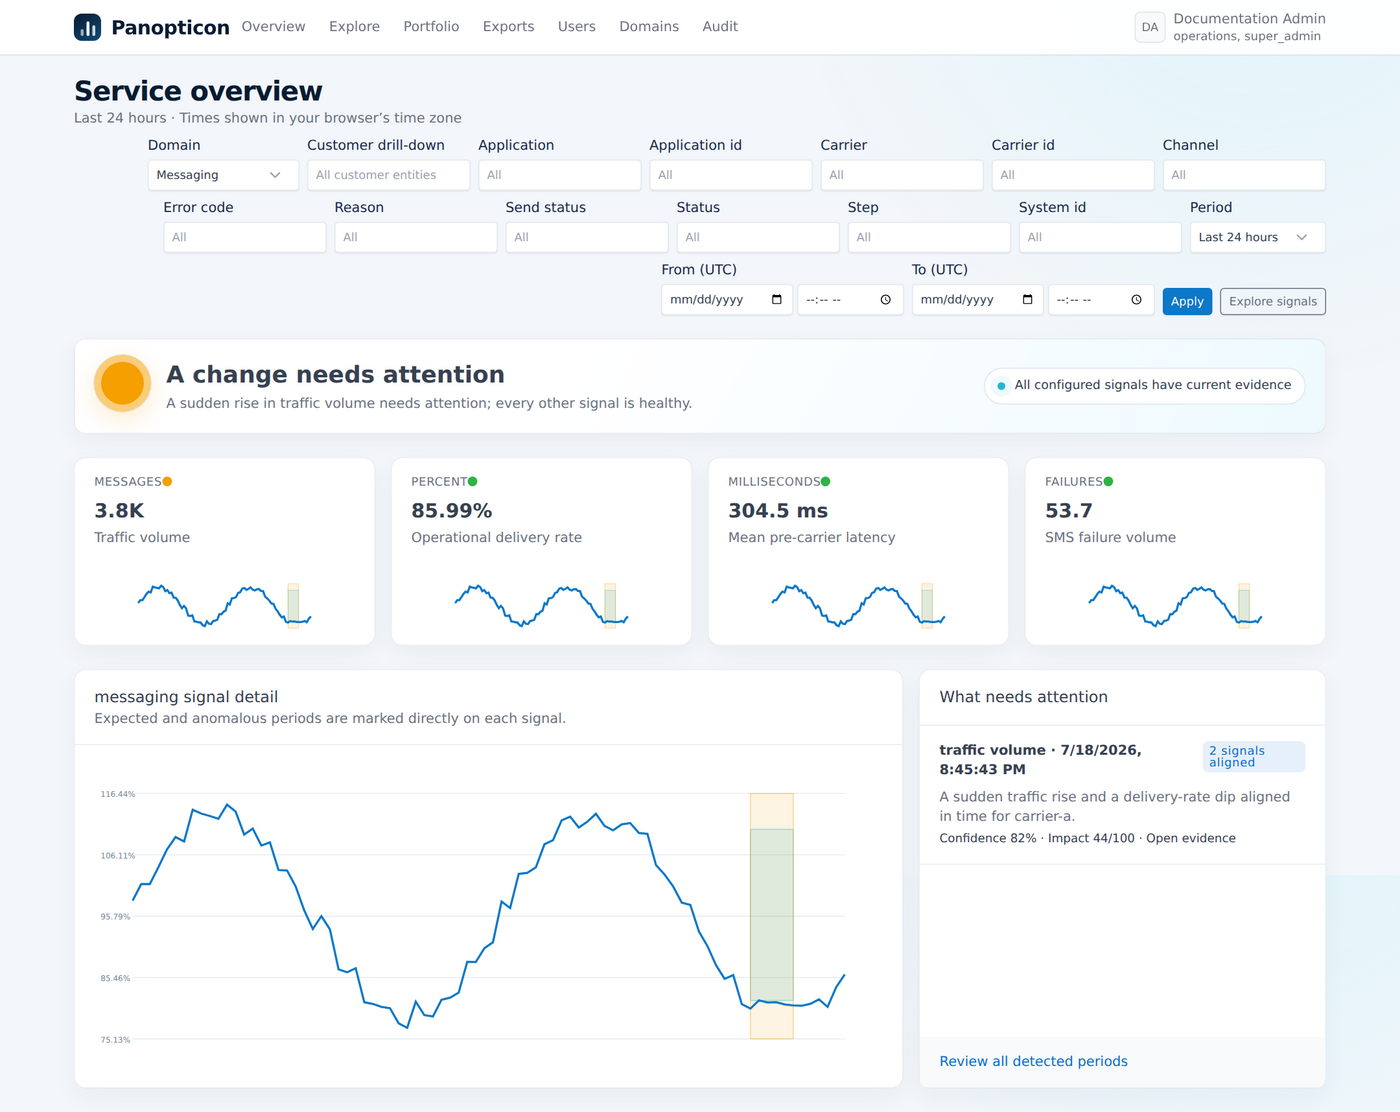
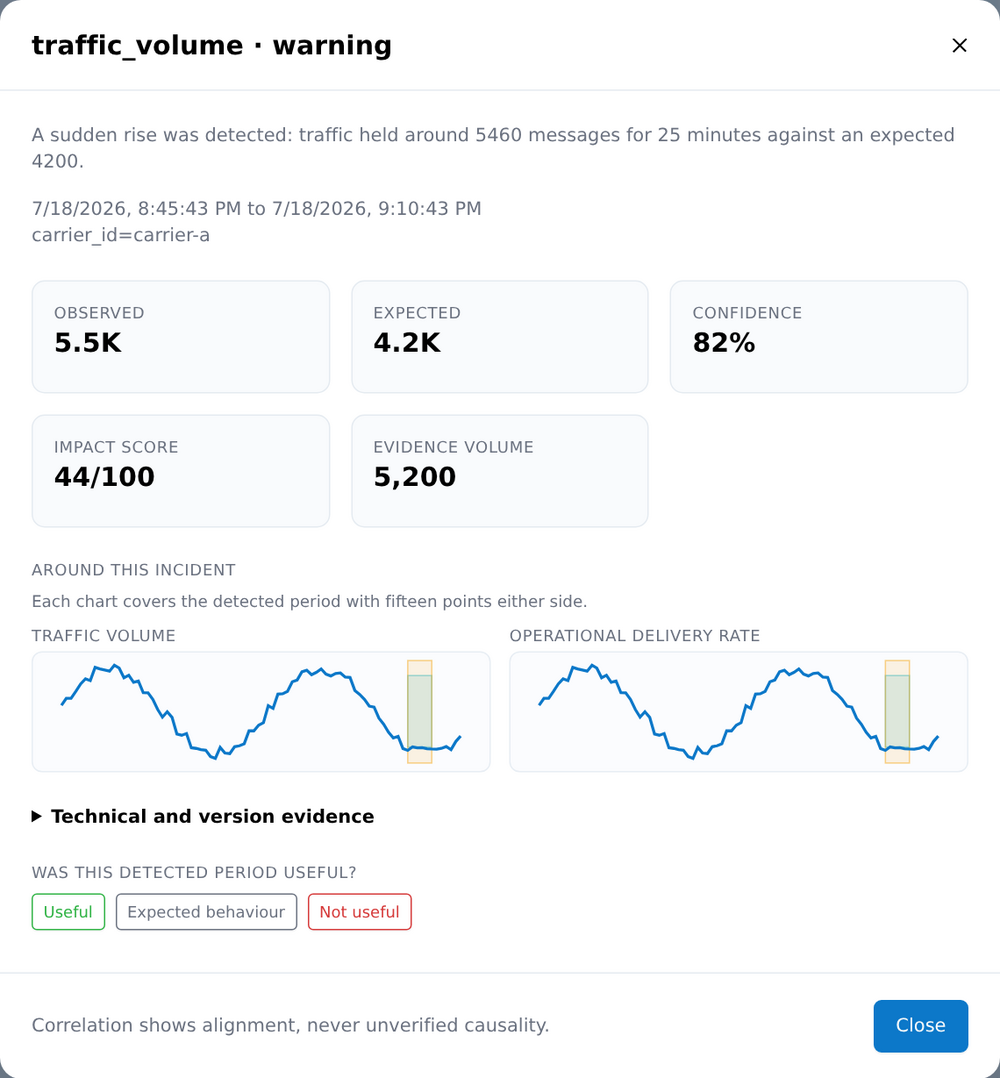
This isn't a mock-up.

Every screenshot on this site is a real, captured screen from the actual application, rendering synthetic data.

Trust

Self-hosted. Server-enforced. No black box.

Isolation is compiled, not filtered

Every query is built server-side with a mandatory customer scope. There is no client-side filter to bypass, because the browser never gets to choose the scope.

Explanations you can read

Every detector is deterministic code, not a model whose reasoning you have to take on faith. Run the same evidence twice and you get the same answer.

Runs on your infrastructure

One binary, your database, your metrics store. Nothing about your customers' data leaves systems you already control.

Read about security →

Ready to stop guessing?

Tell us what you're monitoring today — we'll show you what evidence looks like for it.